The code snippet below creates the above graphic:
## radially symmetric kernel (Gussian kernel)
RadSym <- function(u)
exp(-rowSums(u^2)/2) / (2*pi)^(ncol(u)/2)
## multivariate extension of Scott's bandwidth rule
Scott <- function(data)
t(chol(cov(data))) * nrow(data) ^ (-1/(ncol(data)+4))
## compute KDE at x given data
mvkde <- function(x, data, bandwidth=Scott, kernel=RadSym) {
# bandwidth may be a function or matrix
if(is.function(bandwidth))
bandwidth <- bandwidth(data)
u <- t(solve(bandwidth, t(data) - x))
mean(kernel(u))
}
## compute KDE at (matrix) x given data
smvkde <- function(x, ...)
apply(x, 1, mvkde, ...)
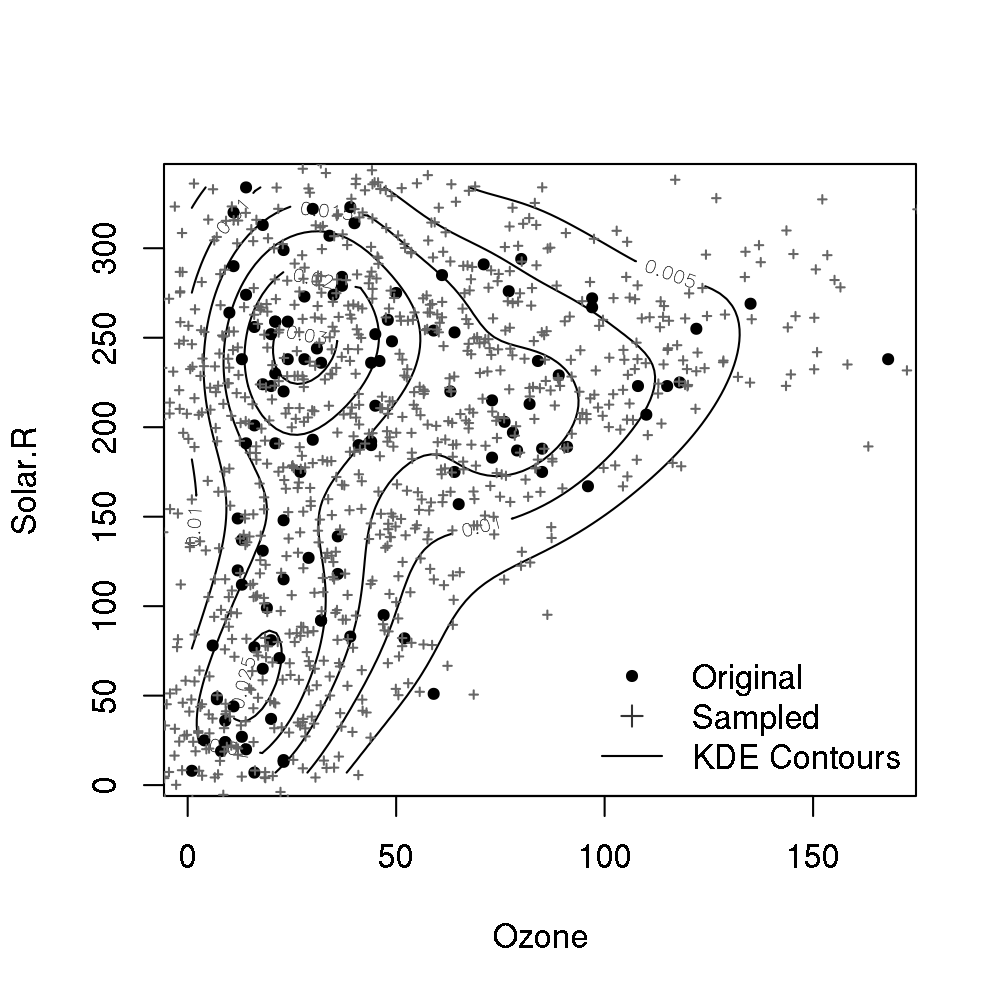
## Example with 'airquality' data
## compute bivariate KDE and plot contours
data("airquality")
aq <- subset(airquality, !is.na(Ozone) & !is.na(Solar.R),
select=c("Ozone", "Solar.R"))
## compute density on a grid of Ozone and Solar.R values
dens.Ozone <- seq(min(aq$Ozone),max(aq$Ozone),length.out=100)
dens.Solar.R <- seq(min(aq$Solar.R),max(aq$Solar.R),length.out=100)
dens.grid <- expand.grid(Ozone=dens.Ozone, Solar.R=dens.Solar.R)
dens.vals <- smvkde(dens.grid, data=aq)
## arrange density values into matrix for easy plotting
dens.mtrx <- matrix(dens.vals, 100, 100)
contour(x=dens.Ozone, y=dens.Solar.R, z=dens.mtrx,
xlab="Ozone", ylab="Solar.R")
points(aq$Ozone, aq$Solar.R, pch=20)
## sample and plot 1000 points from bivariate KDE
## assume Gaussian kernel and Scott bandwidth formula
## 1. sample the original data with replacement
n <- 1000; p <- dim(aq)[2]; set.seed(42)
dens.samp <- aq[sample(1:nrow(aq), size=n, replace=TRUE),]
## 2. add variability by sampling from kernel
dens.samp <- dens.samp + matrix(rnorm(n*p), n, p) %*% Scott(aq)
## 3. plot sampled points
points(dens.samp$Ozone, dens.samp$Solar.R, pch=3,
cex=0.4, col=gray(0.4))
legend("bottomright",
c("Original", "Sampled", "KDE Contours"),
pch=c(20,3,NA),lty=c(NA,NA,1),
col=gray(c(0,0.2,0)), bty="n")