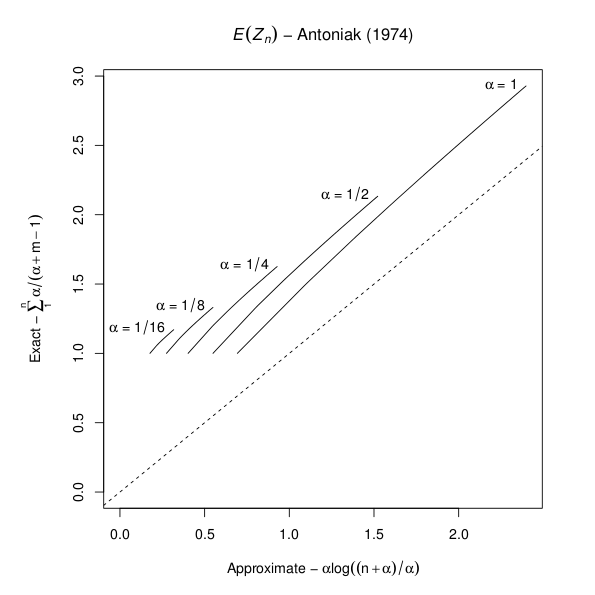
Antoniak's 1974 article titled Mixtures of Dirichlet Processes with Applications to Bayesian Nonparametric Problems (Annals of Statistics 2(6):1152-1174) is a fundamental work for most modern developments in this area. The article gives two expressions for the expected number of distinct values in a sample of size  , drawn from a Dirichlet process-distributed probability distribution with precision parameter
  . The first expression is exact, and the second is approximate. However, I recently discovered (the 'hard way') that the approximation is poor for
  . The following R graphic illustrates the disparity for several values of
  and
and  .
.
R Code
approx <- function(alpha, n) alpha * log((1:n + alpha)/alpha)
exact <- function(alpha, n) cumsum(alpha/(alpha + 1:n - 1))
approx_exact_plot <- function(alp, n, ...) {
     amax <- max(1/alp)
     appmax <- approx(amax, n)
     examax <- exact(amax, n)
     par(mar = c(5, 6, 4, 3) + 0.1)
     plot(appmax, examax, type = "l", xlim = c(0, max(appmax)),
         ylim = c(0, max(examax)),
         main = expression(paste(italic(E)(italic(Z)[italic(n)]), " - Antoniak (1974)")),
         xlab = expression(paste("Approximate - ", alpha, "log", ((n + alpha)/alpha))),
         ylab = expression(paste("Exact - ", sum(alpha/(alpha + m - 1), 1, n))), ...)
     text(max(appmax), max(examax), substitute(paste(alpha, " = ",
         amax)), pos = 2)
     abline(a = 0, b = 1, lty = 2)
     if (length(alp) == 1)
         return()
     for (a in alp[-1]) {
         app <- approx(1/a, n)
         exa <- exact(1/a, n)
         points(app, exa, type = "l")
         text(max(app), max(exa), substitute(paste(alpha, " = ",
             1/a)), pos = 2)
     }
 }
 approx_exact_plot(2^(0:4), 10)
