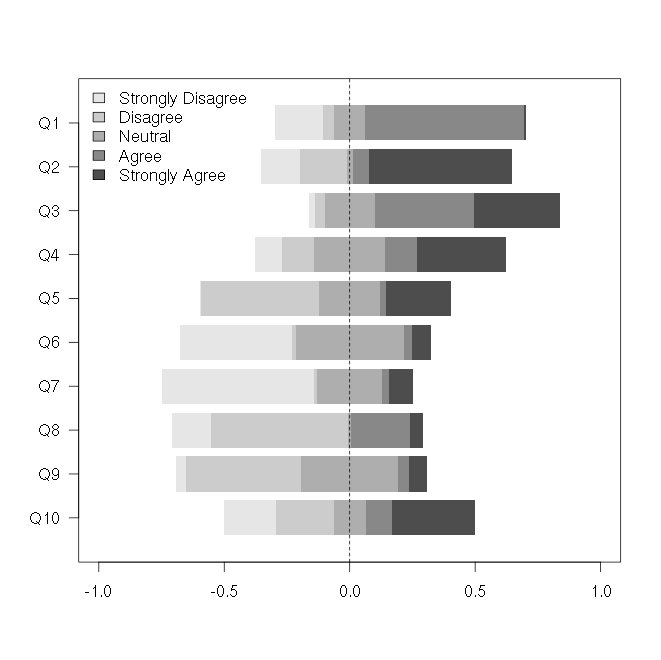
There is a nice package and paper about this here: http://www.jstatsoft.org/v57/i05/paper. However, the associated code is complex and uses lattice. Here's a brief recipe using base graphics that implements the above figure:
set.seed(40)
x <- matrix(rgamma(50,1,1),10,5)
x <- x/rowSums(x)
colnames(x) <- c("Strongly Disagree", "Disagree",
                 "Neutral", "Agree", "Strongly Agree")
rownames(x) <- paste0("Q", 1:nrow(x))


## colors for each category
clrs <- rev(gray.colors(ncol(x))) ## colors

## centering category
acat <- 3 ## "Neutral"

## separation between bars
sepr <- 0.2

## ncol and nrow
nr <- nrow(x)
nc <- ncol(x)

## reorder so that questions 1:nrow(x) go from top down
x <- x[nr:1,]

## compute center offsets
cnof <- apply(x, 1, function(y) {
  lo <- if(acat > 1) sum(y[1:(acat-1)]) else 0
  hi <- sum(y[1:acat])
  lo + (hi-lo)/2
})

## create plot
plot(c(-1,1), c(1,nr), type="n",
     ylim=c(1-(1-sepr)/2-sepr,
            nr+(1-sepr)/2+sepr),
     ylab="", yaxt="n",
     xlab="", )

## plot bars
for(i in 1:nr) {
  for(j in 1:nc) {
    lo <- if(j > 1) sum(x[i,][1:(j-1)]) else 0
    hi <- sum(x[i,][1:j])
    polygon(x=c(lo, lo, hi, hi)-cnof[i],
            y=c(i-(1-sepr)/2, i+(1-sepr)/2,
                i+(1-sepr)/2, i-(1-sepr)/2),
            col=clrs[j], border=NA)
  }
}

## create y-axis
axis(2, at=1:nr, las=2, xpd=NA, labels=rownames(x))
legend("topleft", fill=clrs, bty="n", legend=colnames(x))

## add center line
abline(v=0, lty=2)
Another solution can be found here: http://jason.bryer.org/likert/
Check out the likert package for a ggplot2 implementation of this. More info here: http://jason.bryer.org/likert
Thanks for the links!