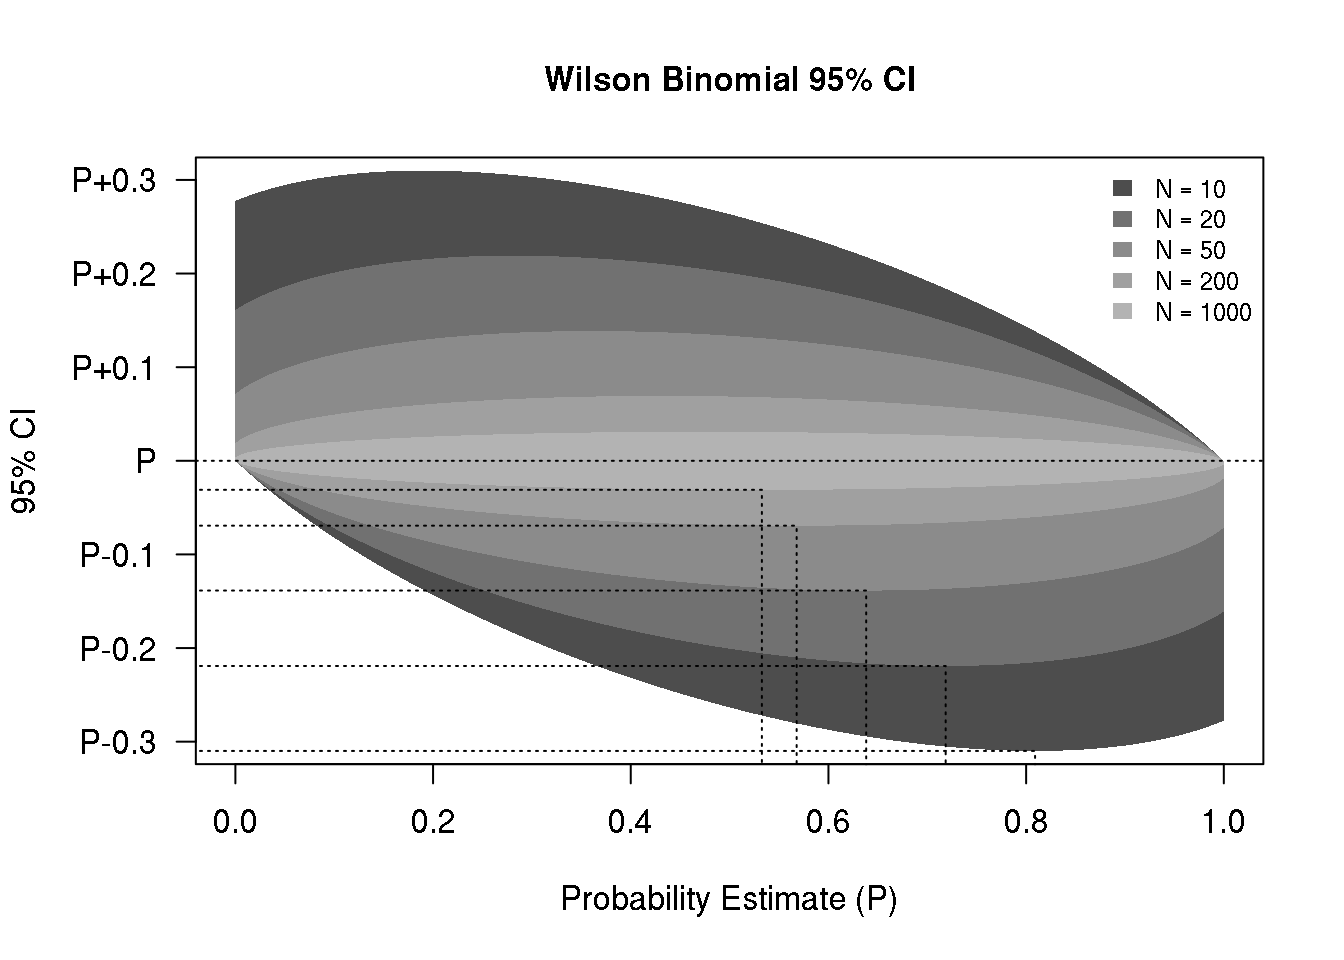
I am often asked about the number of subjects needed to study a binary outcome, which usually leads to a discussion of confidence intervals for binary proportions, and the associated precision. Sometimes the precision is quantified as the width or half-width of a 95% confidence interval. For proportions, I like the Wilson score interval because it’s simple to calculate and does not violate the constraints of probability estimates (i.e., estimates must be between 0 and 1). Below is a function that computes the Wilson interval, given the number of trials (n) and the fraction of events (p).
## Level (1-a) Wilson confidence interval for proportion
## WILSON, E. B. 1927. Probable inference, the law of succession,
## and statistical inference. Journal of the American Statistical
## Association 22: 209-212.
WilsonBinCI <-  function(n, p, a=0.05) {
  z <- qnorm(1-a/2,lower.tail=FALSE)
  l <- 1/(1+1/n*z^2)*(p + 1/2/n*z^2 +
       z*sqrt(1/n*p*(1-p) + 1/4/n^2*z^2))
  u <- 1/(1+1/n*z^2)*(p + 1/2/n*z^2 -
       z*sqrt(1/n*p*(1-p) + 1/4/n^2*z^2))
  list(lower=l, upper=u)
}
The code below generates a figure that illustrates the 95% confidence bounds as a function of the probability estimate, and for a sequence of trial sizes. I’m posting this here for my future easy access, but I hope some readers will find it useful as well, or might suggest improvements.
pseq <- seq(0, 1, length.out=200)
nseq <- c(10,20,50,200,1000)
gcol <- gray.colors(length(nseq), start = 0.3, end = 0.7)
par(mar=c(5,5,4,2)+0.1)
plot(pseq, pseq, type="n",
     ylim=c(-0.3,0.3),
     main="Wilson Binomial 95% CI",
     xlab="Probability Estimate (P)",
     ylab="",
     yaxt="n")
pbnd <- -3:3/10
axis(2, at=pbnd, labels=
       ifelse(pbnd<0, paste0("P",pbnd),
              ifelse(pbnd==0, rep("P",length(pbnd)),
                     paste0("P+",pbnd))),las=2)
mtext("95% CI", 2, line = 4)
legend("topright", paste("N =", nseq),
       fill=gcol, border=NA, bty="n", cex=0.8)

for(i in 1:length(nseq)) {
  bnds <- t(sapply(pseq, function(p)
    unlist(WilsonBinCI(nseq[i], p))))
  bnds <- bnds - pseq
  polygon(x=c(pseq,rev(pseq)),
          y=c(bnds[,2],rev(bnds[,1])),
          border=NA, col=gcol[i])
  pmin <- pseq[which.min(bnds[,1])]
  bmin <- min(bnds[,1])
  lines(x=c(-1,rep(pmin,2)),
        y=c(rep(bmin,2),-1), lty=3)
}
abline(h=0, lty=3)
One thought on “Reference Chart for Precision of Wilson Binomial Proportion Confidence Interval”
Comments are closed.