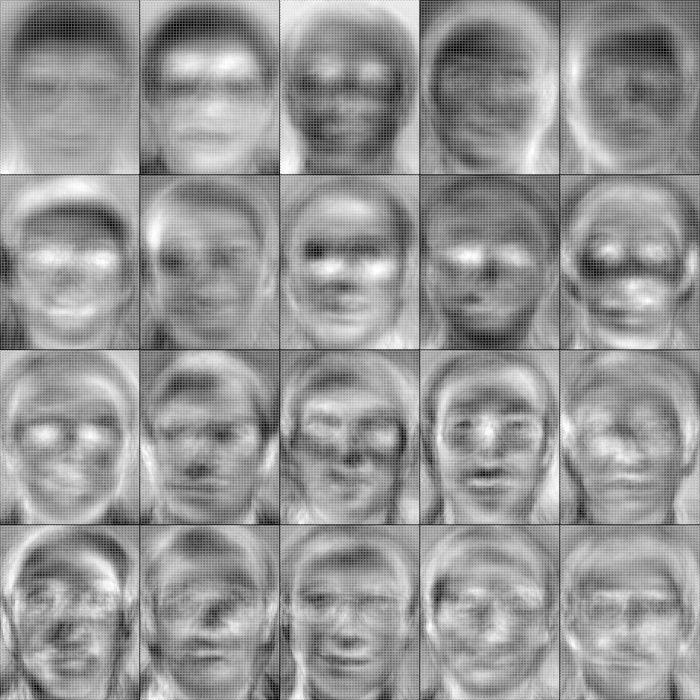
In the course of my dissertation research, I stumbled upon the AT&T Laboratories Cambridge database of faces. The database consists of images of 40 distinct subjects, each in 10 different facial positions and expressions. I had been interested in whether a particular statistical model could recover the 'true' partition in these data, or isolate images of distinct subjects, using only the image data. Each image is 92 x 112 pixels in dimension, taking black-and-white integer values in the 8-bit range (0 to 255). Such high-dimensional images (92 x 112 = 10304) are difficult to work with directly. We can look to data-squashing to help here. (Actually, I'm not sure the term 'data-squashing' was intended for methods like PCA, but it seems appropriate to me.)
Principal components analysis (PCA) was used to reduce the dataset dimensionality. PCA finds a linear transformation of high-dimensional data such that most of the data variability is concentrated onto fewer dimensions. An eigenimage represents a linear transformation of a 92 x 112 black-and-white image onto a single eigenpixel. The pixels of an eigenimage represent the associated linear coefficients, also called variable loadings or factor loadings. PCA of the image data results in a collection of eigenimages. The figure above displays the first twenty eigenimages in reading order. Lighter pixels represent increasingly negative variable loadings, and the opposite for darker pixels.
The variance in the original image pixels were well concentrated on the eigenpixels. The twenty eigenpixels represented by the eigenimage rotations account for 70.0% of the total variation. Remarkably, the first three eigenpixels account for 37.4% of the total variability in the database of faces.
These images have an artistic quality, but also yield some understanding in regard to facial recognition. Presumably, the most variable regions of the face are most recognizable. By studying the the most variable linear transformations (i.e. the top eigenimages) of the images in the face database, we may infer which regions of the face are most important for face recognition.
For example, the first eigenimage (top left) indicates that the head hair region contributes greatly to the variability in the face dataset. Of course, head hair is easily modified. Hence, this inference may not be useful outside the present context. However, the strategy of isolating sources of variability is amenable to more sophisticated methods for extracting facial features.
I've put together an archive of the images, a function to read the PGM image pixels into R, do the PCA, and recreate the graphic above, in less than 60 lines (though I shouldn't boast, else someone will cut it to 20 lines and shame me). You can download the archive here ATTfaces.tar.gz (please be patient, ~3.7MB). From a shell prompt, recreate the graphic as follows:
$ tar -xvzf ATTfaces.tar.gz
$ R -q
> source("ATTfaces.R")
> pcaPlot()